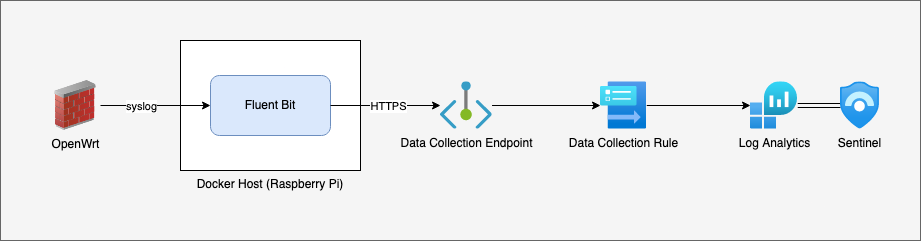
Using Vector to send CommonSecurityLog data to Sentinel
One of the limitations of Microsoft Sentinel and Azure Log Analytics was that if you wanted to use a custom log forwarder or log source, you couldn't write to the built-in tables. You had to create Custom tables, which had a _CL suffix.
This was a problem, because each custom table you added had to be manually added to your Analytic rules and Workbooks, creating stupid inefficiencies.
But this is no more! With the new Logs Ingestion API, Microsoft supports custom data being sent to many built-in tables, including CommonSecurityLog and Syslog.
In this example, we're going to be sending firewall log data from OpenWrt to the standard CommonSecurityLog table, so that we get the benefit of having normalised data, and the built-in Analytic templates.
To set this up, we're going to:
- Identify the data we want to collect and mapping it to CommonSecurityLog
- Create an App Registration
- Create a Data Collection Endpoint (DCE)
- Create a Data Collection Rule (DCR)
- Assign IAM Roles to the DCR
- Install and configure Vector
Mapping iptables to CommonSecurityLog
The first step in ingesting any data into any SIEM is to know what the data is, what you're interested in, and how to normalise it so that you can make use of it. Otherwise, you're just sending garbage into a very expensive garbage pile.
Example OpenWrt iptables logs look like:
[000000.000000] drop wan invalid ct state: IN= OUT=pppoe-wan SRC=203.0.113.42 DST=198.51.100.9 LEN=40 TOS=0x00 PREC=0x00 TTL=64 ID=0 DF PROTO=TCP SPT=52182 DPT=443 WINDOW=0 RES=0x00 RST URGP=0
[000000.000000] drop wan invalid ct state: IN=eth1 OUT=pppoe-wan MAC=aa:aa:aa:aa:aa:aa:bb:bb:bb:bb:bb:bb:08:00 SRC=198.51.100.134 DST=198.51.100.29 LEN=40 TOS=0x00 PREC=0x00 TTL=127 ID=45489 DF PROTO=TCP SPT=56913 DPT=443 WINDOW=0 RES=0x00 ACK RST URGP=0
[000000.000000] reject wan forward: IN=pppoe-wan OUT=eth1 MAC= SRC=2001:0db8:0000:0000:0000:0000:ffff:0002 DST=2001:0db8:aaaa:aaaa:aaaa:aaaa:aaaa:af3c LEN=60 TC=0 HOPLIMIT=57 FLOWLBL=864951 PROTO=TCP SPT=443 DPT=53714 WINDOW=0 RES=0x00 RST URGP=0
[000000.000000] reject wan in: IN=pppoe-wan OUT= MAC= SRC=198.51.100.130 DST=203.0.113.42 LEN=52 TOS=0x00 PREC=0x00 TTL=113 ID=19525 DF PROTO=TCP SPT=53501 DPT=1433 WINDOW=8192 RES=0x00 SYN URGP=0
[000000.000000] reject wan in: IN=pppoe-wan OUT= MAC= SRC=198.51.100.130 DST=203.0.113.42 LEN=52 TOS=0x00 PREC=0x00 TTL=12 ID=31743 PROTO=UDP SPT=12054 DPT=53 LEN=32
[000000.000000] reject wan out: IN=eth1 OUT=pppoe-wan MAC=aa:aa:aa:aa:aa:aa:bb:bb:bb:bb:bb:bb:08:00 SRC=198.51.100.233 DST=198.51.100.1 LEN=84 TOS=0x00 PREC=0x00 TTL=63 ID=15546 PROTO=ICMP TYPE=8 CODE=0 ID=2828 SEQ=0
[000000.000000] accept wan out: IN=eth1.30 OUT=pppoe-wan MAC= SRC=198.51.100.130 DST=203.0.113.42 LEN=52 TOS=0x00 PREC=0x00 TTL=12 ID=31893 PROTO=UDP SPT=24912 DPT=53 LEN=32
Based on these logs, and what I'm interested in, I'm going to normalise the data to the CommonSecurityLog schema using the following fields:
| CommonSecurityLog | datatype | iptables |
|---|---|---|
| TimeGenerated | datetime | |
| CommunicationDirection | string | (in or out) |
| Computer | string | |
| DestinationIP | string | DST= |
| DestinationMACAddress | string | MAC= |
| DestinationPort | int | DPT= |
| DeviceAction | string | (accept, reject, or drop) |
| DeviceCustomString1 | string | (rule interface) |
| DeviceInboundInterface | string | IN= |
| DeviceOutboundInterface | string | OUT= |
| ProcessName | string | |
| Protocol | string | PROTO= |
| ReceiptTime | string | |
| ReceivedBytes | long | LEN= |
| SourceIP | string | SRC= |
| SourceMACAddress | string | MAC= |
| SourcePort | int | SPT= |
| Message | string |
Note: sharp readers will notice I'm keeping the original message field, which effectively duplicates all the relevant data... this is just temporary, as I haven't fully finished my regex filter. At some point in the future, I'll remove the raw message, otherwise I'm just doubling my data costs.
But there are other interesting log types too...
In particular, DNS and DHCP logs are often very useful for detection and network troubleshooting, so we're going to use Vector to extract and send these logs to the ASimDhcpEventLogs and ASimDnsActivityLogs tables.
The DHCP events are easy, so lets start with those:
DHCPREQUEST(eth1) 192.168.1.102 aa:aa:aa:aa:aa:aa
DHCPACK(eth1) 192.168.1.102 aa:aa:aa:aa:aa:aa DESKTOP
By regular expression standards, that's quite trivial:
DHCP(?<EventType>\w+)\((?<DvcInterface>[\w\.\-]+)\) (?<SrcIpAddr>.*?) (?<SrcMacAddr>.*?)( (?<SrcHostname>.*))?
DNS logs however are... a bit trickier. The raw syslog messages look like this:
84114 192.168.1.101/58812 query[A] australiaeast1-0.pushnp.svc.ms from 192.168.1.101
84114 192.168.1.101/58812 forwarded australiaeast1-0.pushnp.svc.ms to 8.8.8.8
84114 192.168.1.101/58812 reply australiaeast1-0.pushnp.svc.ms is <CNAME>
84114 192.168.1.101/58812 reply svc.ha-spo.office.com is <CNAME>
84114 192.168.1.101/58812 reply sharepoint-mrc-ww-acdcatm.trafficmanager.net is <CNAME>
84114 192.168.1.101/58812 reply svc.ms-acdc-spo.office.com is 52.107.238.64
84114 192.168.1.101/58812 reply svc.ms-acdc-spo.office.com is 52.107.238.66
84114 192.168.1.101/58812 reply svc.ms-acdc-spo.office.com is 52.107.238.67
84114 192.168.1.101/58812 reply svc.ms-acdc-spo.office.com is 52.107.238.65
The actual information we want--what did this host query, and what was the response--is split across multiple messages. In each message, we have a transaction ID, source IP and port, the state, the query, and response.
While we could just map and send these events as-is, we're going to be smart and use the awesome reduce transform in Vector to collapse these down to a single event:
{
  "DnsQuery": "australiaeast1-0.pushnp.svc.ms",
  "DnsQueryTypeName": "A",
  "DnsResponseName": "australiaeast1-0.pushnp.svc.ms-><CNAME> svc.ha-spo.office.com-><CNAME> sharepoint-mrc-ww-acdcatm.trafficmanager.net-><CNAME> svc.ms-acdc-spo.office.com->52.107.238.64 svc.ms-acdc-spo.office.com->52.107.238.66 svc.ms-acdc-spo.office.com->52.107.238.67 svc.ms-acdc-spo.office.com->52.107.238.65",
  "DnsSessionId": 84114,
  "EventEndTime": "2025-12-09T17:42:35.783Z",
  "EventStartTime": "2025-12-09T17:42:35.783Z",
  "SrcIpAddr": "192.168.1.101",
  "SrcPortNumber": 58812,
  "TimeGenerated": "2025-12-09T17:42:35.783Z"
}
Which means lower costs (we're creating 1 event instead of 9, with de-duplicated fields), and easier querying (we don't have to | join or | summarize to get the information we need).
Create an App Registration
Unlike the old Data Collector API, which used a static key for the entire workspace, the new Log Ingestion API uses an OAuth flow, so that you can be quite granular about what sources are allowed to send what data to what tables.
This means that we'll need to create an App Registration for Vector. We could use Azure Arc and a Managed System Identity for this instead.
If you want to do this the ClickOps way (there's a one-liner later in this guide):
- Go to https://portal.azure.com/#view/Microsoft_AAD_RegisteredApps/CreateApplicationBlade/quickStartType~/null/isMSAApp~/false
- Enter a name like
vector, leave the Redirect URI blank, and click Register. - Once created, on the Overview page, make a note of the Application (client) ID and Directory (tenant) ID.
- Go to Owners, and set yourself as an Owner. This is good operational practice (so that in large enterprises, there's some clue about who manages what), and it means that you'll always be able to create a new Secret, even if you lose your admin rights.
- Go to Certificates & secrets, and create a new client Secret. Don't forget to add a calendar reminder for the Expiry date, and make a note of the new secret.
Create a Data Collection Endpoint (DCE)
We're also going to need a Data Collection Endpoint (DCE). The DCE is the public URL that will accept data. We can reuse an existing DCE, provided that:
- it's in the same Location (region) as the destination Log Analytics workspace.
- your log source can talk to it, either over the public internet, or a Private Link scope.
To create one,
- Go to https://portal.azure.com/#view/Microsoft_Azure_Monitoring/CreateDataCollectionEndpointViewModel/_provisioningContext~/
- Select the Resource Group of your Sentinel / Log Analytics workspace
- Make sure the Location is also the same!
- And hit create
Create a DCR to send data to CommonSecurityLog
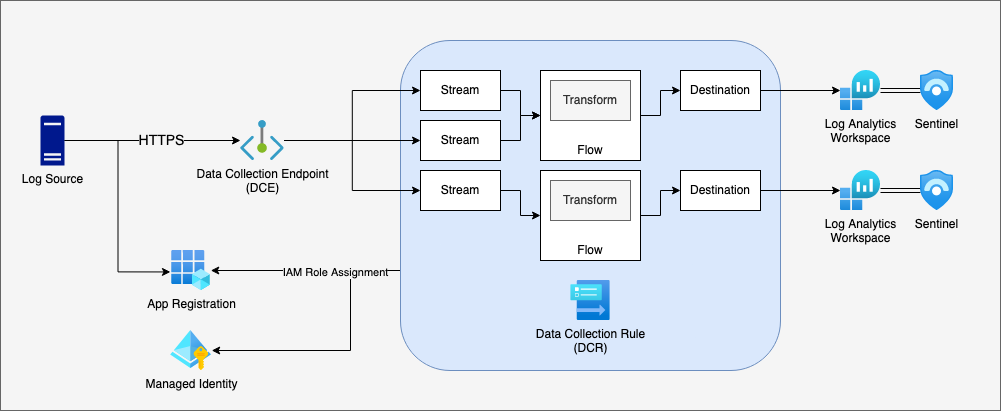
The Data Collection Rule (DCR) is used to glue together the ingest pipeline. A DCR:
- is linked to a specific DCE;
- contains one or more Streams, which define what input data columns and types to allow;
- contains one or more Destinations, the Log Analytics workspaces;
- contains one or more Flows, which map a Stream to a Destination via a Transform Rule; and
- contains Azure IAM Roles assigned to App Registrations / Service Principals / Managed Identities, so that ingest can be controlled.
Or, put visually:
You can't (currently) use the Azure Portal to create a DCR that sends custom data to the built-in tables. For this step, we need to create an ARM Template.
To make this bit easy for you, I've prepared the ARM template below in a nice tidy Deploy to Azure button:

What this ARM template does is:
- Create the
Custom-ASimDhcpEventLogs,Custom-ASimDnsActivityLogs,Custom-CommonSecurityLog, andCustom-Syslogstreams. This is important: these streams must contain the fields we've mapped above because any extra fields will simply be discarded.- This includes fields generated/mapped by Vector, like
TimeGeneratedandComputer; and fields extracted through the parser, likeDestinationIPandSourcePort.
- This includes fields generated/mapped by Vector, like
- Maps these streams to the output tables
Microsoft-ASimDhcpEventLogs,Microsoft-ASimDnsActivityLogs,Microsoft-CommonSecurityLog, andMicrosoft-Syslog. Unlike custom tables, which have aCustom-prefix, the built-in tables use theMicrosoft-prefix. This template uses atransformKqlof "source": in other words, it won't transform the source data, just passing it through as-is.
Once you create the DCR, you'll also need to get the immutable ID (looks like dcr-00000000000000000000000000000000). If you view the DCR in the Azure Portal, click JSON View.
Of course, if you don't trust the magic Deploy to Azure button, you can view the template at https://gist.github.com/jlaundry/a37c0d1d8929ad103517c3efff61f7a1.
Note: When viewing the JSON file in vscode, you may get a warning along the lines of
Value is not accepted. Valid values: "Microsoft-Event", "Microsoft-InsightsMetrics", "Microsoft-Perf", "Microsoft-Syslog", "Microsoft-WindowsEvent".. You can safely ignore this - it's just a validation warning because Microsoft haven't updated the JSON schema yet.
Assign IAM Roles to the DCR
Once you've created the DCR, the final step is to assign an IAM Role to the App Registration we created before.
If you've already created the App Registration, then in the Azure Portal, go to the DCR, click Access control (IAM), and Add role assignment. You want to assign Monitoring Metrics Publisher to the App Registration.
If you haven't created the App Registration, you can do it in one step with the command:
az ad sp create-for-rbac -n "vector" --role "Monitoring Metrics Publisher" --scopes "/subscriptions/${SUBSCRIPTION_ID}/resourceGroups/${RESOURCE_GROUP_NAME}/providers/Microsoft.Insights/dataCollectionRules/vector"
Install and configure Vector
There are lots of ways to install Vector... just go read the docs at https://vector.dev/docs/setup/installation/ 😉
The azure_logs_ingestion sink feature was merged in late February 2026, and should be in Vector v0.54.0. You can test it now, by building Vector from source (see the docs for details).
Based on our mapping, we're going to need to use a regular expression to parse the OpenWrt syslog messages, and tag them with the appropriate column names. Tying it all together, my vector.yaml looks like:
api:
  enabled: true

sources:
  syslog:
    type: syslog
    address: 0.0.0.0:1514
    mode: udp

transforms:
  kernel:
    type: filter
    inputs:
      - syslog
    condition: .appname == "kernel"

  dnsmasq_dhcp:
    type: filter
    inputs:
      - syslog
    condition: .appname == "dnsmasq-dhcp"

  dnsmasq_dns:
    type: filter
    inputs:
      - syslog
    condition: .appname == "dnsmasq"

  other_syslog:
    type: filter
    inputs:
      - syslog
    condition: .appname != "kernel" && .appname != "dnsmasq-dhcp" && .appname != "dnsmasq"

  dnsmasq_dns_remap:
    type: remap
    inputs:
      - dnsmasq_dns
    reroute_dropped: true
    source: |-
      . |= parse_regex!(.message, r'^(?<DnsSessionId>\d+) (?<SrcIpAddr>[\w\.:]+)\/(?<SrcPortNumber>\d+) (?<_Action>(reply|query\[(?<DnsQueryTypeName>\w+)\]|forwarded|cached|config)) (?<DnsQuery>.*?) (is (?<DnsResponseName>.*)$)?')
      if ends_with(._Action, "]") {
        ._Action = split(._Action, "[", limit:2)[0]
      }
      .TimeGenerated = del(.timestamp)
      if .DnsResponseName == null {
        del(.DnsResponseName)
      } else {
        .DnsResponseName = .DnsQuery + "->" + .DnsResponseName
      }
      del(.appname)
      del(.facility)
      del(.host)
      del(.hostname)
      del(.procid)
      del(.severity)
      del(.source_ip)
      del(.source_type)

  dnsmasq_dns_filter:
    type: filter
    inputs:
      - dnsmasq_dns_remap
    condition: ._Action != "forwarded" && !ends_with(to_string!(.message), "reply query is duplicate")

  dnsmasq_dns_reduce:
    type: reduce
    inputs:
      - dnsmasq_dns_filter
    group_by:
      - SrcIpAddr
      - SrcPortNumber
      - DnsSessionId
    starts_when: "._Action == \"query\""
    # Don't do this - there may be multiple replies
    #ends_when: "._Action == \"reply\" || ._Action == \"cached\""
    merge_strategies:
      DnsResponseName: concat

  remapped_ASimDnsActivityLogs:
    type: remap
    inputs:
      - dnsmasq_dns_reduce
    source: |-
      .EventStartTime = .TimeGenerated
      .EventEndTime = del(.TimeGenerated_end)
      .SrcPortNumber = to_int!(.SrcPortNumber)
      del(._Action)
      del(.message)

  remapped_ASimDhcpEventLogs:
    type: remap
    inputs:
      - dnsmasq_dhcp
    reroute_dropped: true
    source: |-
      . |= parse_regex!(.message, r'^DHCP(?<EventType>\w+)\((?<DvcInterface>[\w\.\-]+)\) (?<SrcIpAddr>.*?) (?<SrcMacAddr>.*?)( (?<SrcHostname>.*))?$')
      .DvcHostname = del(.host)
      .DvcIpAddr = del(.source_ip)
      .TimeGenerated = del(.timestamp)

      del(.appname)
      del(.facility)
      del(.hostname)
      del(.procid)
      del(.severity)
      del(.source_type)

  remapped_CommonSecurityLog:
    type: remap
    inputs:
      - kernel
    reroute_dropped: true
    source: |-
      . |= parse_regex!(.message, r'(?<DeviceAction>reject|accept|drop) (?<DeviceCustomString1>.*?) (?<CommunicationDirection>[\w\s]+): IN=(?<DeviceInboundInterface>[\w\-\.]+)? OUT=(?<DeviceOutboundInterface>[\w\-\.]+)?( MAC=((?<DestinationMACAddress>\w\w:\w\w:\w\w:\w\w:\w\w:\w\w):(?<SourceMACAddress>\w\w:\w\w:\w\w:\w\w:\w\w:\w\w):\w\w:\w\w)?)? SRC=(?<SourceIP>[\w\.\:]+) DST=(?<DestinationIP>[\w\.\:]+) LEN=(?<ReceivedBytes>\d+) .* PROTO=(?<Protocol>[\w\d]+)( SPT=(?<SourcePort>\d+) DPT=(?<DestinationPort>\d+))?')
      .Computer = del(.host)
      .DestinationPort = to_int!(.DestinationPort)
      .ReceivedBytes = to_int!(.ReceivedBytes)
      .SourcePort = to_int!(.SourcePort)
      .TimeGenerated = del(.timestamp)
      .Message = del(.message)

      del(.appname)
      del(.facility)
      del(.hostname)
      del(.severity)
      del(.source_ip)
      del(.source_type)

  remapped_Syslog:
    type: remap
    inputs:
      - other_syslog
      - dnsmasq_dns_remap.dropped
      - remapped_ASimDhcpEventLogs.dropped
      - remapped_CommonSecurityLog.dropped
    source: |-
      .TimeGenerated = del(.timestamp)
      .Computer = del(.host)
      .Facility = del(.facility)
      .HostIP = del(.source_ip)
      .HostName = del(.hostname)
      .ProcessID = del(.procid)
      .ProcessName = del(.appname)
      .SeverityLevel = del(.severity)
      .SyslogMessage = del(.message)

      del(.source_type)

sinks:
  console:
    type: console
    inputs:
      - dnsmasq_dns_remap.dropped
      - remapped_ASimDhcpEventLogs.dropped
      - remapped_CommonSecurityLog.dropped
    encoding:
      codec: json
      json:
        pretty: true
  azure_ASimDhcpEventLogs:
    type: azure_logs_ingestion
    inputs:
      - remapped_ASimDhcpEventLogs
    endpoint: https://vector-0000.westus2-1.ingest.monitor.azure.com
    dcr_immutable_id: dcr-00000000000000000000000000000000
    stream_name: Custom-ASimDhcpEventLogs
    auth:
      azure_tenant_id: 00000000-0000-0000-0000-000000000000
      azure_client_id: 00000000-0000-0000-0000-000000000000
      azure_client_secret: ${AZURE_CLIENT_SECRET:?err}
  azure_ASimDnsActivityLogs:
    type: azure_logs_ingestion
    inputs:
      - remapped_ASimDnsActivityLogs
    endpoint: https://vector-0000.westus2-1.ingest.monitor.azure.com
    dcr_immutable_id: dcr-00000000000000000000000000000000
    stream_name: Custom-ASimDnsActivityLogs
    auth:
      azure_tenant_id: 00000000-0000-0000-0000-000000000000
      azure_client_id: 00000000-0000-0000-0000-000000000000
      azure_client_secret: ${AZURE_CLIENT_SECRET:?err}
  azure_CommonSecurityLog:
    type: azure_logs_ingestion
    inputs:
      - remapped_CommonSecurityLog
    endpoint: https://vector-0000.westus2-1.ingest.monitor.azure.com
    dcr_immutable_id: dcr-00000000000000000000000000000000
    stream_name: Custom-CommonSecurityLog
    auth:
      azure_tenant_id: 00000000-0000-0000-0000-000000000000
      azure_client_id: 00000000-0000-0000-0000-000000000000
      azure_client_secret: ${AZURE_CLIENT_SECRET:?err}
  azure_Syslog:
    type: azure_logs_ingestion
    inputs:
      - remapped_Syslog
    endpoint: https://vector-0000.westus2-1.ingest.monitor.azure.com
    dcr_immutable_id: dcr-00000000000000000000000000000000
    stream_name: Custom-Syslog
    auth:
      azure_tenant_id: 00000000-0000-0000-0000-000000000000
      azure_client_id: 00000000-0000-0000-0000-000000000000
      azure_client_secret: ${AZURE_CLIENT_SECRET:?err}
In OpenWrt,
- Go to System > System > Logging, and enter your host IP and port (1514 is used in the above example).
- Go to Network > DHCP and DNS > Log, and enable Log queries. I also change the Log facility to USER, just to make troubleshooting future issues easier.
- Save & Apply
Finally, run the above config with vector -c vector.yaml, and you should see your logs flowing into Sentinel in near-real-time! 🎉